Earned Value Management (EVM)
1. Why EVM? — Purpose and Motivation
EVM is a project performance measurement technique that integrates three key aspects of a project:
scope, schedule, and cost — so managers can see not just how much has been spent, but also what has been achieved for that money and whether the project is on track.
It helps answer three vital questions:
- Where have we been? (past performance)
- Where are we now? (current status)
- Where are we going? (future forecast)
Traditional tracking compares budget vs. actual cost — which tells only whether you are spending more or less than planned.
EVM goes further: it combines cost, schedule, and progress into one integrated picture. That gives early warning signals about delays or overruns, and allows forecasting of final cost and finish date.
Historically, EVM was developed in U.S. defense projects in the 1960s and later formalized through standards such as EIA-748.
In modern software development, it provides a quantitative tracking method, avoiding vague statements like “we’re about 50% done.”
2. Key Concepts and Metrics
 Source. link
2.1 Baseline Concepts
These form the foundation of all EVM calculations.
| Term | Meaning | Example |
|---|---|---|
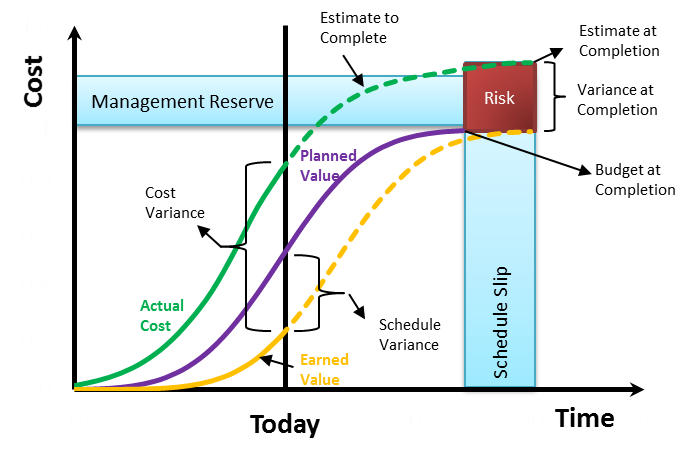
| Budget at Completion (BAC) | Total planned cost for completing the project. | Total approved budget = $500 000. |
| Planned Value (PV) | (Also BCWS) — The budgeted cost of the work planned to be done by a certain date. | We planned to complete 60% by month 3 → PV = 0.6 × BAC. |
| Earned Value (EV) | (Also BCWP) — The budgeted cost of the work actually completed by that date. | If 50% of the work is done → EV = 0.5 × BAC. |
| Actual Cost (AC) | (Also ACWP) — The real cost spent for the work performed so far. | We’ve spent $280 000 so far → AC = 280 000. |
These let us compare what we planned, what we earned, and what we spent.
2.2 Variances and Performance Indices
These indicators show if the project is ahead/behind schedule and under/over budget.
| Measure | Formula | Meaning |
|---|---|---|
| Cost Variance (CV) | EV − AC | Positive → under budget; Negative → over budget. |
| Schedule Variance (SV) | EV − PV | Positive → ahead of schedule; Negative → behind schedule. |
| Cost Performance Index (CPI) | EV ÷ AC | CPI ≥ 1 → good cost performance. |
| Schedule Performance Index (SPI) | EV ÷ PV | SPI ≥ 1 → good schedule performance. |
Example:
If EV = 200 000 and AC = 250 000, then CPI = 0.8 → you earn only $0.80 of planned value per $1 spent → cost overrun.
2.3 Forecasting Metrics
These help predict the future outcome based on current trends.
- Estimate at Completion (EAC): projected total project cost at completion.
- Common formula: EAC = BAC / CPI (if current cost performance continues).
- Estimate to Complete (ETC): expected cost to finish remaining work.
- ETC = EAC − AC.
These allow early forecasts of whether the project will finish within budget or over budget.
3. Implementing EVM — Steps and Practical Use
3.1 Establish the Performance Measurement Baseline (PMB)
- Break down the project into work packages using a Work Breakdown Structure (WBS).
- Assign budgets and schedules to each task — this defines the PV over time.
- Define who is responsible for each control account (a section of work).
- “Freeze” the baseline (scope, budget, schedule) — so you have a stable reference point.
3.2 Collect Actual Data and Measure Progress
At regular reporting intervals:
- Record Actual Cost (AC) from financial data.
- Determine % complete for each task to calculate Earned Value (EV).
- Compare against Planned Value (PV) for that date.
- Compute CV, SV, CPI, and SPI to assess health.
3.3 Analyse and Forecast
Interpret the results:
- A CPI = 0.9 → you’re earning €0.90 of value for every €1 spent (cost overrun).
- A SPI = 0.8 → progress is only 80% of what was planned (schedule delay).
- Forecast total cost (EAC) and decide if corrective action or re-planning is needed.
- Investigate root causes (e.g., scope creep, poor estimation, resource shortage).
- Adjust resources or re-baseline if justified.
3.4 Tips and Common Pitfalls
- Measuring % complete is hard in software — use objective milestones (e.g., “code committed and reviewed,” not “halfway done”).
- Avoid frequent baseline changes — they make performance trends meaningless.
- EVM works best when scope, schedule, and cost are well-defined and integrated.
- Communicate EVM results clearly — CPI and SPI are simple but powerful indicators.
4. Why EVM Matters in Software Project Tracking
- Converts vague statements like “QA is 40% done” into quantitative, time-phased data.
- Encourages clear definitions of tasks, scope, and expected deliverables.
- Provides early warnings:
- If SPI < 1 and CPI < 1, both schedule and budget are slipping — act early!
- Links tracking (current performance) with forecasting (future outcome).
- Encourages evidence-based management instead of intuition-based updates.
5. Further Reading
Primary Sources (Official Standards)
- EIA-748 Standard for Earned Value Management Systems — NDIA IPMD Application Guide
Download PDF - Project Management Institute (PMI): Earned Value Management Systems (EVMS)
PMI Article
Good Primers
- “Earned Value Primer: The Basics of EVM” — OnlinePMCourses
- “A Beginner’s Guide to Earned Value Management” — Nulab
Disclaimer: AI is used for text summarization, explaining and formatting. Authors have verified all facts and claims. In case of an error, feel free to file an issue or fix with a pull request.