Defining Success
Project success is a definition somebody writes, not a property a project turns out to have. Change the definition and the same projects change from successes to failures without anything happening to the software — which is why the industry failure rates students are quoted disagree so widely.
1. The same database, two answers
The Standish Group’s CHAOS reports publish two success definitions side by side [1]:
- Traditional Resolution — on time, on budget, and on target, meaning the delivery “contained a good number of the estimated features and functions”.
- Modern Resolution — on time, on budget, and a satisfactory result, “regardless of the original scope”.
For FY2015 the same database gives 36% successful under the first definition and 29% under the second — the report itself puts the difference at about seven points. Nothing about the projects changed. When someone quotes you a failure rate, the first question is which definition produced it.
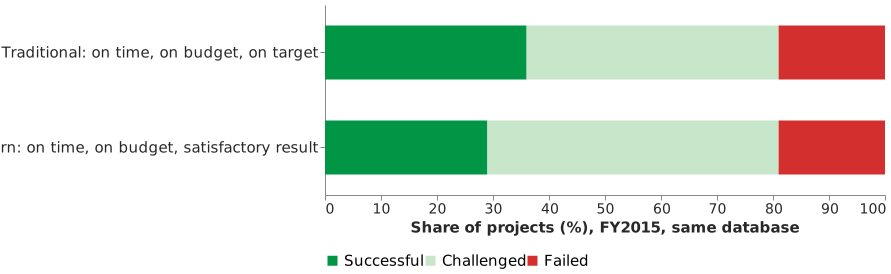 The same projects, scored two ways. [1]
2. Why the definition matters more than the number
Eveleens and Verhoef examined what those definitions actually measure [2]: a “successful” project is one that matched its own forecast, so an organisation can improve its score by estimating worse. They demonstrate it on 5,457 forecasts across 1,211 real projects.
The result worth remembering is a single organisation in that study. For example, Org X had the worst forecasting accuracy in the whole sample — half its projects were out by 233% or more — and the second-highest CHAOS-style success rate, 67%. In the same analysis, two datasets with identical forecast quality score 5.8% and 94.2%, differing only in the direction of the bias. The authors conclude the figures “are misleading, one-sided, pervert the estimation practice, and result in meaningless figures.”
That is Goodhart’s law arriving early: a measure that rewards matching your estimate rewards padding your estimate.
Never quote a CHAOS figure without this critique attached. The reports carry no named author, no peer review, no sampling frame and no response rate, and Standish’s own disclaimer asks readers to treat the contents as opinion.
3. What the evidence does support
A McKinsey study with the University of Oxford examined more than 5,400 IT projects with initial budgets above $15 million [3]. Its headline is three separate numbers rather than one verdict: on average these projects ran 45% over budget, 7% over time, and delivered 56% less value than predicted.
Software projects were worse than the headline: 66% cost overrun and 33% schedule overrun. That is the figure this subject should carry, and it is the one a CHAOS-only slide does not give you.
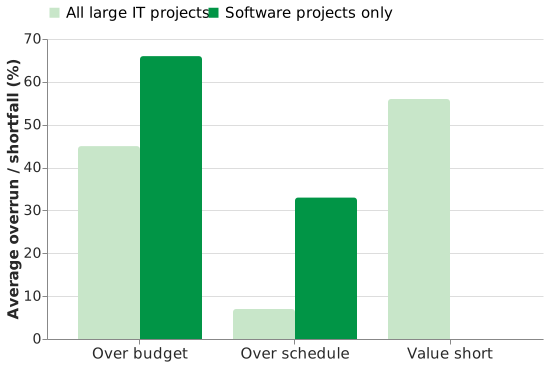 All large IT against software alone, on the same study. [3]
Two further findings change decisions:
- 17% of large IT projects go so badly that “they can threaten the very existence of the company”.
- The cost-overrun rate rises about 15% for each additional project year — which makes shortening a project a risk control, not merely a delivery preference.
4. The limitation, and it is a real one
Every figure above is about large projects: the $15M threshold bounds the McKinsey dataset entirely, and it is consultancy research with no peer review and no independently auditable method. None of it is evidence about a small team’s first release. What transfers is not the percentage but the mechanism — that outcomes are measured against a forecast somebody chose, and that longer projects drift further from it.
The practical response is on the threshold of success page: write the criteria down in advance, make each one binary, and you do not have to argue afterwards about which definition applied.
How solid is this?
- Where it comes from. Eveleens and Verhoef is peer-reviewed (IEEE Software, 2010) and is the strongest source here; McKinsey is grey literature with a stated population and method; the CHAOS reports are vendor publications and are used only as evidence of what they themselves claim.
- What is contested. Eveleens does not claim projects succeed more often than reported, only that the Standish figures cannot tell you either way. Its own case-study rates are an upper bound, because cancelled projects are excluded.
- What we do not hold. McKinsey’s causal attributions are the authors’ coding of their own dataset, not measured causes, and are not reproduced here.
Acknowledgments
This page adapts material from lectures by Eduardo Miranda and David Root [4] on software project management.
References
- The Standish Group International,“CHAOS Report 2015,” The Standish Group International, Inc., 2015.
- J. L. Eveleens and C. Verhoef,“The Rise and Fall of the Chaos Report Figures,” IEEE Software, vol. 27, no. 1, pp. 30–36, 2010, doi: 10.1109/MS.2009.154.
- M. Bloch, S. Blumberg, and J. Laartz,“Delivering Large-Scale IT Projects On Time, On Budget, and On Value,” McKinsey & Company, McKinsey on Business Technology, Oct. 2012.
- D. Root,Managing Software Development. Carnegie Mellon University / Innopolis University lecture series, 2014.
Disclaimer: AI is used for text summarization, polishing and explaining. Authors have verified all facts and claims. In case of an error, feel free to file an issue.