Why We Misjudge Risk
Risk estimates go wrong in patterned ways, not random ones. Two patterns matter most: the scoring scheme distorts the ranking, and the distribution of outcomes has a fat tail that planning ignores. Both have repairs.
1. The scale you chose changes the answer
For example, take three outcomes, keep their probabilities and consequences identical, and change only whether the score scale runs 1-up or 1-down. The ranking reverses: the worst outcome moves from last place to first [1]. “Would such a method stand up to scrutiny in a court of law?”
The underlying problem is that there is no theory licensing the multiplication of two ordinal scores: the practice “seems to be an attempt to mimic the calculation of expected loss” without being it. Three further distortions are measured:
- Category-definition bias. Told explicitly that “very likely” meant a probability above 0.9, participants still assigned it values from 0.43 to 0.99 — an “illusion of communication”.
- Centering bias. 83% of probability scores and 52% of consequence scores landed in the middle of the scale, so a 5×5 matrix operates as a 3×3.
- Range compression. A top band reading “more than $20 million” treats a $20M loss and a $50-billion one identically.
Two audit rules catch a badly built matrix [2]: a red cell and a green cell must never share an edge, and no red cell may sit in the left-most column or the bottom row.
2. The tail is where the money is
Across 5,392 IT projects, the median cost-overrun ratio is 1.0 and the mean is 1.8 [3]. Half of all projects come in at or under budget; the average is 80% over. The entire gap between those two numbers is the tail.
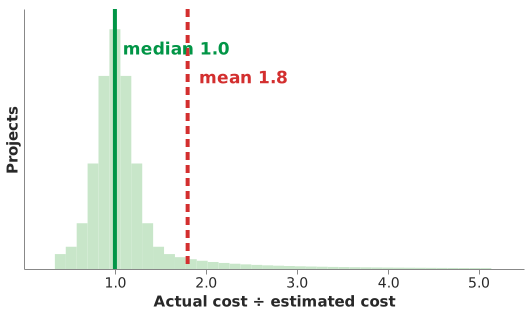 Half are on budget. The average is 80% over. [3]
Deeper in that tail the arithmetic stops working: the distribution is a power law whose exponent falls below 2 at the extreme cut-offs — at which point no mean exists at all. In the authors’ words, “the average cost overrun for IT projects does not exist.”
Three findings stop a student exempting themselves:
- These are not outliers but “extreme values that follow a highly regular and predictable power-law pattern.”
- The tail survived every split of the data — by size, type, duration and source. “This does not apply to our kind of project” is not available as an answer.
- The worst overrun in the dataset was small. A workflow-customisation project budgeted at $1,500 cost $425,000 — a ratio of 280.
The mechanism is actionable rather than fatalistic. A simulation of 300 components with realistic interdependencies reproduced the power-law tail on its own — no incompetence, no optimism, no scope creep. Dependency structure alone is sufficient. So identify the components everything else depends on and fund them first, which is the same move as mitigating the drivers in a risk-area digraph.
3. What to do instead
- Rank by expected loss in money or weeks, not by cell colour.
- Write the numeric range next to the label, so likely never travels alone.
- Fix the scale direction and the category boundaries before assessing anything, and record them — changing either changes the answer.
- Size contingency for the tail, not the median. Those projects carried “little contingency (up to 15%)” on most likely figures: a plan for the mode of a distribution whose mean is 80% over.
- Take the outside view — your own project memory is a small sample, and small samples understate the tail.
4. The limits of debiasing
Keep the matrix for the conversation; settle the order elsewhere. The critics concede as much — “any approach that generates some discussion of the risks in a particular activity will be helpful” — and none argues that risk assessment is futile.
Expected loss is not the final answer either: two risks with the same expected consequence can warrant different responses, because “a rare but severe risk contributor may warrant a response different from that warranted by a frequent, less severe contributor” [4]. And the literature on cognitive bias in software engineering finds far more evidence that biases exist than that any intervention reliably removes them [5].
How solid is this?
- Where it comes from. One large empirical study (5,392 projects), one mathematical critique from constructed counterexamples, one literature check of 30 industry papers, and an agency handbook’s self-assessment.
- What is contested. Nothing between these sources, but the matrix critique’s field evidence is oil and gas and its proposed alternative is heavier than most projects can carry.
- What we do not hold. The overrun study measures budget and schedule only and excludes terminated projects, so the real picture is if anything worse.
References
- P. Thomas, R. B. Bratvold, and J. E. Bickel,“The Risk of Using Risk Matrices,” SPE Economics & Management, vol. 6, no. 2, pp. 56–66, Apr. 2014, doi: 10.2118/166269-PA.
- L. A. Cox,“What’s Wrong with Risk Matrices?,” Risk Analysis, vol. 28, no. 2, pp. 497–512, Apr. 2008, doi: 10.1111/j.1539-6924.2008.01030.x.
- B. Flyvbjerg, A. Budzier, J. S. Lee, M. Keil, D. Lunn, and D. W. Bester,“The Empirical Reality of IT Project Cost Overruns: Discovering a Power-Law Distribution,” Journal of Management Information Systems, vol. 39, no. 3, pp. 607–639, 2022, doi: 10.1080/07421222.2022.2096544.
- NASA,“NASA Systems Engineering Handbook,” National Aeronautics and Space Administration, NASA Special Publication SP-2007-6105 Rev1, Dec. 2007. [Online]. Available: https://www.nasa.gov/reference/systems-engineering-handbook/
- R. Mohanani, I. Salman, B. Turhan, P. Rodríguez, and P. Ralph,“Cognitive Biases in Software Engineering: A Systematic Mapping Study,” IEEE Transactions on Software Engineering, vol. 46, no. 12, pp. 1318–1339, 2020, doi: 10.1109/TSE.2018.2877759.
Disclaimer: AI is used for text summarization, polishing and explaining. Authors have verified all facts and claims. In case of an error, feel free to file an issue.