PERT and merge bias
PERT is a network scheduling method that asks for three duration estimates per task, optimistic, most likely and pessimistic, and computes an expected time from them [1]. Merge bias is why its finish date, like a critical-path date, comes out early: where parallel paths merge, the project waits for the latest of them [2].
1. Three estimates instead of one
PERT was developed for the US Navy’s Special Projects Office with Booz Allen & Hamilton to control the Polaris missile programme, and published in 1959. Its name first stood for Program Evaluation Research Task. The authors modelled each duration as a beta distribution peaking at the most likely value [1], which gives the familiar rule: expected time is the optimistic estimate, plus four times the most likely, plus the pessimistic, divided by six.
CPM, its twin, uses one number per task. Brooks called any critical-path network a PERT chart [3], which is why the two names are used loosely.
2. The most likely date is not a likely date
Task durations are skewed: “while you can do only a limited number of things to shorten the duration of a task, the number of things that can go wrong is almost unlimited.” In Miranda’s illustration, a task estimated at 10, 20 and 40 days has under a 40% chance of finishing by its most likely date. Its expected finish is about 23 days, and 75% confidence needs 27 [4].
3. Merge bias
A project finishes when its last path finishes, and the average of a maximum is never below the average of any single path. So “the PERT-calculated mean is generally less than, and never greater than, the true project mean” [2]. CPM’s inventors had seen the direction, not the size [5].
MacCrimmon and Ryavec measured the effect. Two equal, independent paths, each averaging 0.50: the later one averages 0.63. Add a third: 0.69. PERT reports 0.50 every time [2].

MacCrimmon and Ryavec 1962, Figs. 7–8.
Miranda’s sentence is the one to remember: “The merged path results in a mechanism that passes on delays but seldom passes on savings” [4].
4. Example: Quill’s acceptance run
Quill is a fictional word processor whose critical path is nine weeks. Three paths merge into the publisher’s acceptance run: Ana’s PDF work (seven weeks), Ivan’s cloud sync (six) and Dana’s citation work (three). The plan starts acceptance in week 8, on Ana’s path alone. But Ivan’s path is only a week shorter: a bad fortnight on cloud sync delays acceptance as surely as one on PDF tuning, and Ana finishing early saves nothing while Ivan is late. For example, if two developers are each 50/50 to finish by Friday, integration starts on Friday one week in four. Dana’s path, less than half as long, barely matters.
5. What makes it worse, and what to do
The bias grows with “many independently parallel paths having approximately equal durations”. It shrinks with slack: when the second of two paths was half as long as the first, PERT’s error fell to half a per cent. It also shrinks when paths share activities [2].
So the response is targeted, not a flat margin on everything:
- Treat the computed finish as a lower bound, never as the forecast.
- Watch the nearly critical paths as closely as the critical one.
- Where the date matters, simulate the network from per-task ranges [6].
Software adds a twist. Miranda calls assuming independent task durations “perhaps one of the most dangerous assumptions a project manager can make”: underestimate the system’s complexity and every task sharing that cause runs late together [4].
6. The estimates are short too
Merge bias works even on perfect estimates, and estimates are not perfect. People hold “a confident belief that one’s own project will proceed as planned, even while knowing that the vast majority of similar projects have run late”: the planning fallacy. Students forecasting their theses guessed 33.9 days and took 55.5 [7].
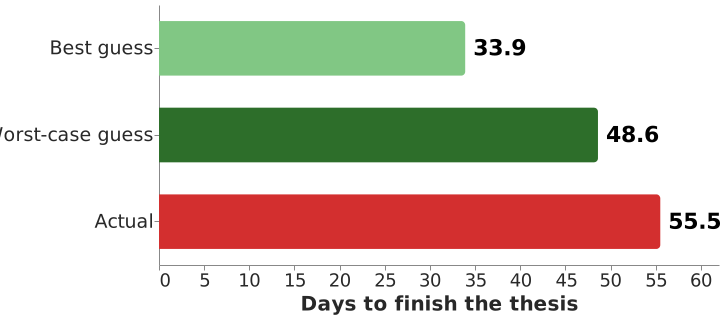
Buehler, Griffin and Ross 1994, Study 1.
Why added safety still gets spent is on critical chain; see also why we misjudge risk.
How solid is this?
- Where it comes from. MacCrimmon and Ryavec’s results are analytical, on small constructed networks, and they say generalisation is possible “only to a very limited extent”. The quotes are from the 1962 RAND memorandum behind the journal paper. Miranda’s 10/20/40 task is an illustration.
- What is attributed. The name merge bias is later usage; the report speaks of parallel paths.
- Who was measured. The planning-fallacy studies used psychology undergraduates forecasting their own coursework, not developers committing to a manager.
Acknowledgments
This page adapts material from lectures by Eduardo Miranda [8] on software project management.
References
- D. G. Malcolm, J. H. Roseboom, C. E. Clark, and W. Fazar,“Application of a Technique for Research and Development Program Evaluation,” Operations Research, vol. 7, no. 5, pp. 646–669, 1959, doi: 10.1287/opre.7.5.646.
- K. R. MacCrimmon and C. A. Ryavec,“An Analytical Study of the PERT Assumptions,” Operations Research, vol. 12, no. 1, pp. 16–37, 1964, doi: 10.1287/opre.12.1.16.
- F. P. Brooks,The mythical man-month (anniversary ed.). Addison-Wesley Longman Publishing Co., Inc., 1995.
- E. Miranda,“Planning and executing time-bound projects,” Computer, vol. 35, no. 3, pp. 73–79, Mar. 2002, doi: 10.1109/2.989933.
- J. E. Kelley Jr. and M. R. Walker,“Critical-Path Planning and Scheduling,” in Papers Presented at the December 1–3, 1959, Eastern Joint IRE-AIEE-ACM Computer Conference, ACM, 1959, pp. 160–173. doi: 10.1145/1460299.1460318.
- R. Buehler, D. Griffin, and M. Ross,“Exploring the ‘Planning Fallacy’: Why People Underestimate Their Task Completion Times,” Journal of Personality and Social Psychology, vol. 67, no. 3, pp. 366–381, 1994, doi: 10.1037/0022-3514.67.3.366.
- E. Miranda,“Managing Software Development.” 2014.
Disclaimer: AI is used for text summarization, polishing and explaining. Authors have verified all facts and claims. In case of an error, feel free to file an issue.